In 2003, the San Antonio Spurs moved from the centrally-located downtown Alamodome to the AT&T Center firmly nestled in San Antonio’s east side, in Bexar County. There were a number of positives that came with the move — the AT&T Center is a much more modern arena, and it was (for the most part!) built for basketball. The cheap seats at AT&T are a bit better than the cheap nosebleeds in the Alamodome, and the concessions/amenities are vastly improved. There was, of course, one small tic the Spurs had to accept when moving into the AT&T Center. They had to accept the fact that they’d be effectively evicted from their home during the month of February on a yearly basis, as the AT&T Center was partially built to serve as an all-time landing spot for the San Antonio Stock Show & Rodeo. Without a home to roam on, the Spurs agreed indefinitely to roll out for a February road trip that would take San Antonio all over the U.S.A.
That was in 2013. Twelve years later, the road trip has firmly wedged its way into the Spurs mythos. Famously, San Antonio has yet to experience a losing rodeo road trip. Coach Popovich and the players regularly imply that the trip itself serves as a bonding experience that brings the team together and starts building the relationships they’ll need in the playoffs. Spurs fans look at the trip as a litmus test for the team’s season, and opposing fans watch with curiosity to see if the Spurs are finally creaking. Dan McCarney wrote a nice history of the trip a few years back — with the benefit of two more years of trips, I compiled the statistics wrote a nice little reference going over them. Let’s take a look back at 12 years of San Antonio’s rodeo travels.
• • •
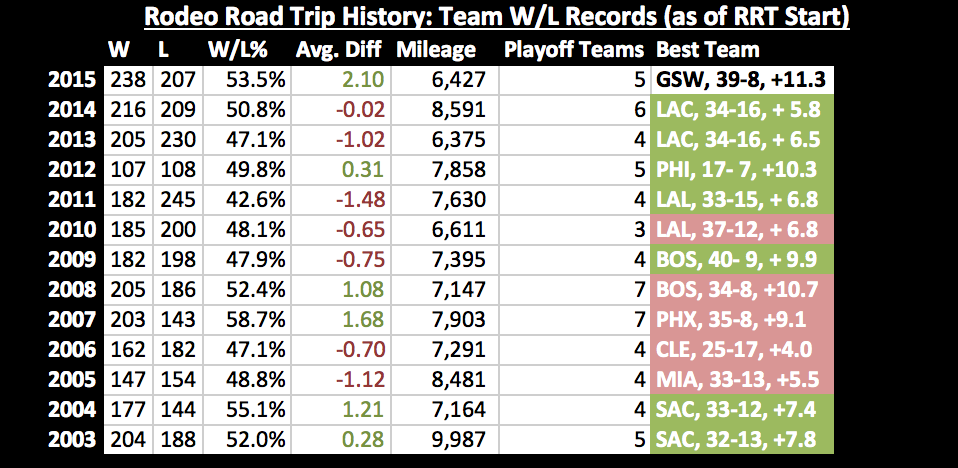
To start, I looked up team records and differentials for the teams San Antonio faced on their rodeo road trips. I looked these up right when the trip started, so that 2015 would be comparable to the rest of them. The W/L columns are (obviously) the collective win/loss records of every team San Antonio faced on the trip as of day #1 of the trip, and the average differential averages all their point differentials on that same day. Mileage is a rough estimate (via Google Maps, with some help from Dan McCarney’s piece above) of how many miles the Spurs had to travel for the trip. The “playoff teams” column sums up how many of their road trip opponents would’ve been playoff teams. The last column, “best team”, outlines the best team they played on that year’s trip (considering each team’s rating and record at the time the trip began). The coloring of that column indicates whether they won or lost that game. (So, the Spurs currently own a 7-5 record against the reigning “best team faced” among all RRT teams. Neat!)
For those wondering about how this year’s trip stacks up, it’s pretty high up there. The Spurs will be facing the hardest trip by point differential they’ve ever taken, with 5/9 teams currently playoff teams and 2 more possible playoff teams in Indiana and Detroit. The main thing that makes this year’s trip so challenging is just how good the good teams are. The Warriors, Blazers, Raptors, and Clippers should all be reasonably favored against the Spurs going into the trip, and Phoenix is a push given that it comes on a back-to-back. The Spurs have four games that should be gimmes (DET, IND, UTA, SAC), but all the tough ones are very tough. And clever readers might notice that they’ve already lost to 3 of those 4 gimmes this season, which makes it hard to count any of those teams out.
• • •
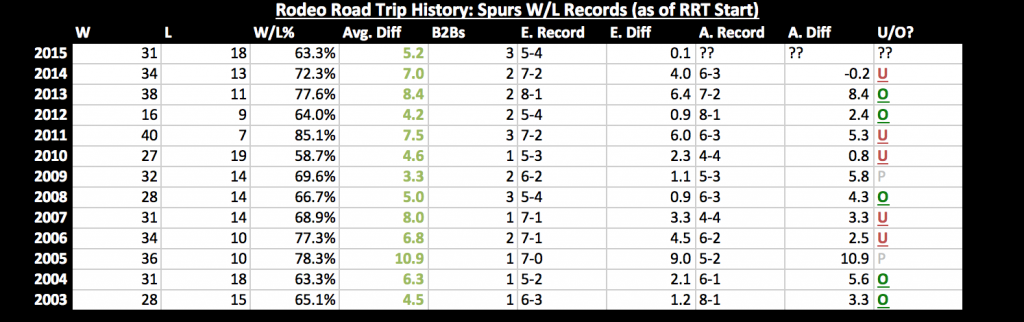
Next up, I collected data on what the Spurs themselves looked like going into each year’s trip. From that, I was able to calculate expected W/L profiles and differentials for each year using point margin at the onset of the trip as well as an adjustment for home court. I also counted the number of back to backs and added an underperformed/overperformed column that measures whether the Spurs undershot my projection or overshot my projection. (Note: in that column, “P” stands for “push”, indicating a year where they underperformed in differential or record but overperformed in the other). Via my projections, the Spurs underperformed five years and overperformed five years, with a push in two years. So, they undershot as often as they overshot, meaning my expectations are (likely) calibrated correctly.
One of the big takeaways you can make from this table? When you adjust for the quality of their opponent, the Spurs were actually favored in a surprisingly large number of Rodeo Road Trip games. If you sum the expected record column, the Spurs have an expected record of 75-25 over the 11 trips they’ve completed to date. Their actual record is a hair under that, at 71-29. This may seem odd at first glance — NBA teams are traditionally much worse on the road, with home court advantage worth roughly 3 points a night. Historically, road teams have won roughly 40% of their games in the last decade (although that number has fallen in recent years).
Ergo, it’s odd at first glance to think that San Antonio’s expected record on these trips is a 75% win percentage. Right? Not quite. That simplification ignores the obvious. The Spurs simply aren’t a random road team. Their lowest point differential at the time of the trip was +3.3 in 2009. That +3.3 isn’t really that bad — even their lowest year was still_ remarkably high_ for the NBA as a whole:
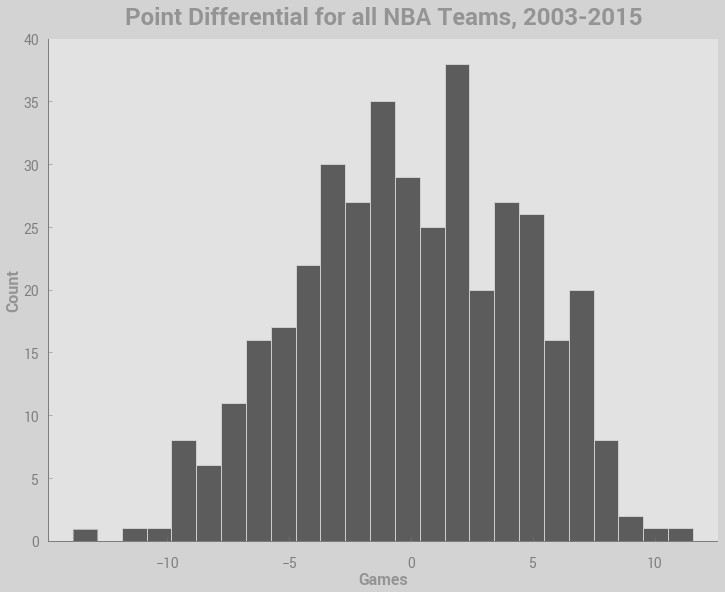
A point differential of +3.3 is low for the Spurs, but it’s still a top-percentile team — among every full-season point differential in the last 12 years, +3.3 is still in the 73rd percentile. That means it’s better than almost 75% of all NBA teams that have plied their trade since the Spurs moved into the Alamodome. Even when the Spurs are bad, they aren’t THAT bad. Hence their historical performance on the Rodeo Road Trip — even if you give all the road teams their a home court advantage of +3 points a night (slightly higher than the actuality in many cases), the Spurs are still favored in a remarkable number of their road trip contests because they were consistently outclassing the competition.
• • •
Some errata and miscellany I found interesting while digging for this post:
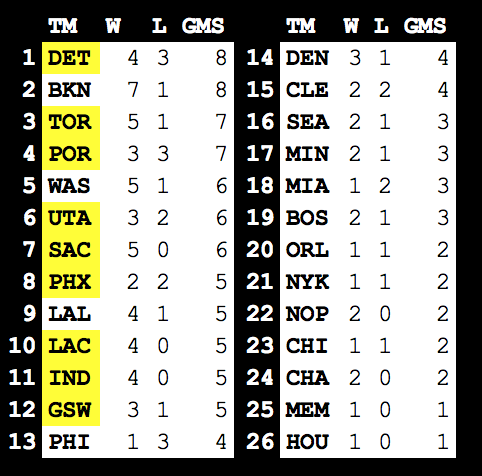
- The Spurs have faced a lot of different teams on the Rodeo trip, but there are a few teams it faces far more often than others. The Spurs have faced the Nets and Pistons on eight road trips apiece and they’ve faced Toronto and Portland on seven apiece. Personally, this weirds me out — Portland is one of the toughest road trips in the NBA, and I have legitimately no idea why the NBA’s scheduling gods like to add that so often. The team-by-team list of who the Spurs have faced (with W/L records) is here, with teams from this year’s trip highlighted:
-
There are a few other interesting nuggets from the previous chart. The Spurs only have a losing record against two teams in the history of the Rodeo Road Trip — Miami (1-2) and Philadelphia (1-3). Ironically, of those games against Philadelphia, the one win came against a team that (at the time) looked like the best Philadelphia team since their title winning eighties days — the 2012 Sixers that started the season on fire and led the league in point differential up until the season’s midway point. The Spurs are undefeated on the Rodeo trip against SAC, LAC, IND, NOP, CHA, MEM, and HOU — seven whole NBA teams!
-
There are three teams that the Spurs have never faced on any of their rodeo road trips — the Dallas Mavericks, the Milwaukee Bucks, and the Atlanta Hawks. Eagle eyed readers will also note that they’ve never faced the Oklahoma City Thunder on a Rodeo trip — every trip to that franchise happened when they were in Seattle.
-
As expected, the Spurs play worse when they face back to back games on their rodeo trips. The Spurs have gone 12-9 on back to back games across all Rodeo Road Trips, with a point differential of +0.7 in those 21 games. However, going by point differential alone, the Spurs would have been expected to go 14-7 with a differential of +3.4. So they lost two wins and underperformed even in the wins they got. It’s worth noting, though, that there is one massive outlier value there — in 2012, the Spurs punctuated an (at the time) 7-0 road trip with one of the worst defeats in franchise history, a 40 point blasting at the Rose Garden. If you take out the 40 point disappointment, the Spurs went 12-8 with a differential of +2.7, which is far less out of line with the expectation.
-
After 12 years of trips, there are a lot of pretty great wins to choose from. Three of them were particularly absurd:
- 2013: The 38-11 Spurs were one point dogs against the 34-16 Clippers. They won by 26 points.
- 2010: The 27-19 Spurs were four point dogs against the 33-15 Nuggets. They won by 19 points.
- 2012: The 16-9 Spurs were nine point dogs against the 17-7 Sixers. They won by 10 points.
-
Conversely, there are also a lot of baffling losses. Their three worst losses, expectation-wise:
- 2012: The 16-9 Spurs were five point dogs against the 14-10 Blazers. They lost by 40 points.
- 2007: The 31-14 Spurs were nine point favorites against the 19-25 Heat. They lost by 15 points.
- 2011: The 40-7 Spurs were four point favorites against the 25-22 Blazers. They lost by 13 points.
-
In their title years, the Spurs have overachieved once, underachieved twice, and pushed (worse record, better differential) once. So, no — there’s no obvious connection between success on their rodeo trip and playoff success.
• • •
Have a question? Ask it in the comments below! I’ll update this post with more data if there are interesting lines of inquiry.