Playoff Questions: Does Denver's Home Court Advantage Translate?

Posted on Mon 29 April 2013 in The Stats They Carried by Aaron McGuire

curry landry

Hey, all. Aaron here. Both Alex and I have an enormous wealth of statistical expertise on our side -- I've got a degree in statistical science and work as a professional statistician in the banking industry, he has a degree in salamander geography and used a calculator once. Given this, as the 2013 Playoffs soldier on, we're planning to occasionally tackle statistical quirks and curiosities we find interesting or elucidating. Answer the questions that we forgot to ask in the first place. Et cetera, et cetera. Today's topic: Denver's mountain air. Or, more accurately, the diminishing returns thereof.

Entering the playoffs, things looked pretty simple for any garden variety prognosticator. Chalk looked poised to reign -- none of the one-through-three seeds in either conference looked even remotely prime for an upset. Teams had either finished the season strong (DEN), faced opponents that were so depressingly injured that they could solve their late-season struggles (SAS), or were simply in a class completely beyond their opponent (MIA). It just didn't look like there were going to be any upsets on the top-line -- if anything, perhaps there'd be an upset in the 4/5 spot, but those are scarcely upsets at all. Chalk, chalk, chalk. Chalk everywhere.

"Well..."

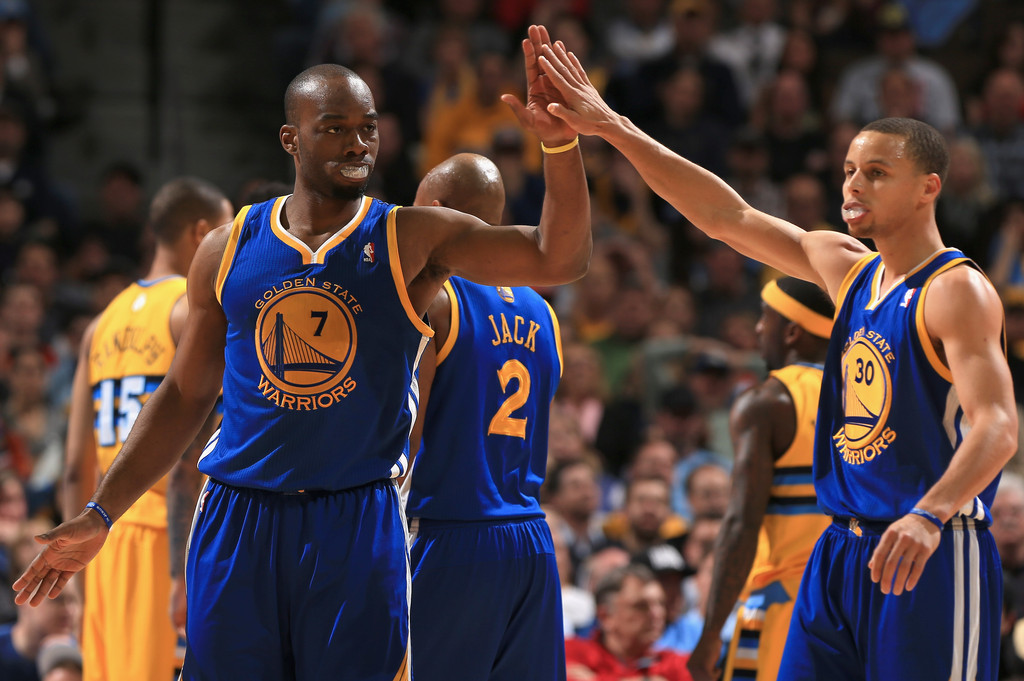
As we stand, the Warriors are on the verge of a monumental upset. Don't sell this Nuggets team short -- they won 57 games, posted a home efficiency differential that makes lambs bleat, and feature a wealth of talent with an excellent play-calling coach. The Warriors limped into the playoffs with a late season slide that took them from a contender for HCA to the verge of the eight seed -- for a short period of time, it actually looked like they were a threat to miss the playoffs. During the 2013 calendar year, the Warriors posted a regular season record of 26-25, just ONE game above 0.500 -- the Nuggets were 40-10. So you must excuse me if I'm hammering the point home a bit: this Nuggets team is a good team, and what the Warriors are doing is reasonably surprising (even if I wrote several good -- and strangely prescient -- reasons why the Warriors had a good shot at the upset in the Gothic Ginobili series preview).

One of the few things we thought we knew going into the playoffs was this: the Warriors couldn't possibly beat the Nuggets at home. That was part of why many smart analysts chose the Nuggets in 5 -- even if the Warriors match up reasonably well with the Nuggets, there was theoretically no threat of Denver dropping any of their home games in the first round. Simply impossible. The Nuggets were 38-3 at home this season. Entering their first round series, they'd won 23 straight home games. Of course, that ended up being a somewhat silly worry -- the Nuggets were a few errant calls and an Andre Miller explosion away from losing game 1, and they got thoroughly embarrassed in a game two blowout that wasn't as close as the 131-117 score made it seem. Down 3-1 with their backs against the wall, it's tough to figure out how to handicap these Nuggets. They WERE unbeatable at home -- are they, still? Or was the appearance of infallibility bunk to begin with? In our first installment of our stat-based playoff feature, I'll examine that question.

• • •

To start out, here's a bit of the "how" behind my examination. We could simply look at win-loss records to see if the Nuggets have lived up to expectations in the playoffs. That's sort of silly, though, because we have a wealth of other information. To try and take into account the severity of the effect and the true measure of Denver's home performances, we'll be looking at Denver's margin of victory in each series since the first round expanded to 4 games in 2003 -- that's 12 series results in 10 playoff appearances by Denver, so we'll have ample room to make a few observations. For each series played, I've compiled the following statistics:

  • The basic stats -- Denver's seed in that year's playoffs as well as their W/L record.

  • SRS -- Basketball Reference's "SRS" rating for both Denver and their opponent in the given playoff round. SRS is useful for this exercise because it's a pace-adjusted rating measured at a baseline of zero -- a team with an SRS of 7 is 7 points better than average, whereas a team with an SRS of -7 is 7 points worse than average. This means that you can create neutral court expectations with SRS -- that is, a team with an SRS of 2 versus a team with an SRS of -2 would be expected to win a neutral-court matchup between those two teams by four points. If they win by more, they've overachieved. If they win by less, they've underacheived.

  • Playoff & Regular Season Home Stats -- how Denver performed at home during that year's playoffs and that year's regular season. Includes playoff W/L as well as the differential in those wins and losses. Same with the regular season. Nice side-by-side look.

  • Home Expectations -- Finally, the crux of the analysis lies here. Very simple calculations, because in this case, simplicity lends itself to cleaner analysis. For Denver's "predicted" Home Court advantage, I assume that their home schedule "evened out" in any given season. That is, that their overall home court differential reflects Denver's performance against an average team at home. Then I use the difference in SRS ratings between Denver and their opponent to either add to or subtract from that predicted differential. If they're better than their opponent in SRS, that adds to their predicted home margin. If they're worse than their opponent in SRS, that subtracts from it. Then I simply show the actual playoff home differential minus the predicted home differential. In essence, that gives you a one number view as to whether Denver lived up to expectations, surpassed them, or underwhelmed in any given playoff season. Red indicates an under-performance, green indicates an over-performance, gray indicates too-close-to-call (remember, small sample size means large margin of error -- I rounded to five for this one.)

That's the rundown. Now here's your table.

denver hca

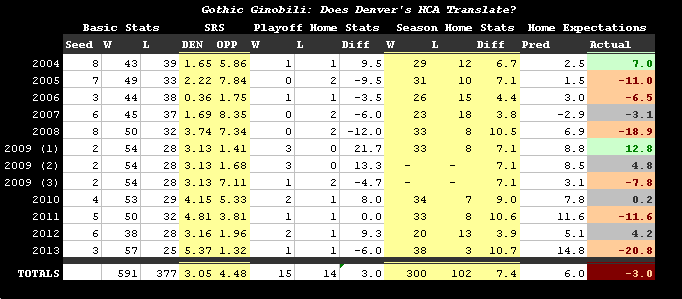
A few observations to guide you through, here.

First, it's worth pointing out the obvious -- Denver has been astonishingly good at home. Over the past 10 seasons, the Nuggets have gone 3oo-102 at home during the regular season and 291-275 on the road. That's a heck of a split, and I'm reasonably sure that's the largest in the league. They've beaten teams by an average of 7.4 points per game on their home floor over, once again, the past 10 years. There's no low sample size at play in that part. That's a huge sample. They just dominate at home, period. Regular season teams have no remedy for Denver whatsoever.

Second, it's also worth pointing out the again-somewhat-obvious -- Denver isn't nearly as good at home in the playoffs. They're 15-14 at home in the playoffs over that span, and they posted an outright negative point differential at home in 6 of those 12 series outlined above. On average, they've outscored opponents by 3 points over the 29 home games in this study. Given their respective average ratings compared to their opponents and their regular season performance, Denver would be expected to outscore opponents by 6 points per game in those 29 home games. That means that the Denver Nuggets have on the whole underachieved in their playoff home games in the past decade, occasionally by large margins. (In fact, if you take out their outlier series against a wounded Hornets team in 2009, they've underachieved by an average of FIVE points per game below expectations.) Given the data, we can state with relative confidence that Denver simply isn't the same home team in the playoffs that they are during the regular season.

Something's different. But what?

• • •

I've got a few theories. None are airtight, but there's probably a grain of truth to each of them.

  • THEORY #1: The atmospheric boon of the regular season is the bane of the postseason. I used to live in the Southwest. Someday, I plan to live there again. The atmosphere is invigorating, and the hiking is sincerely beautiful. Whenever I visit home for a long period of time, I undergo a day or two of calibration before I go on any hikes or big projects. Because it takes a little while to re-acclimate myself to the air and the weather. I have a suspicion that the same is true for an NBA team. The Nuggets have all season to acclimate themselves to the invigorating mountain air of the Denver expanse. In the regular season, though, most NBA teams have one to two days to do that at the very most. In the playoffs? They have significantly more time. As an example... before their game two blowout, the Warriors were in Denver for six straight days. I think they -- and many others over the years -- simply got themselves acclimated to the Denver air. And they nullified the usual Denver advantage.

  • THEORY #2: Pace of play bears some responsibility. Over the last decade, the Nuggets have had a number of different teams. But they all seem to exhibit a similar general theme. They rely more on transition points and athletic brilliance than a methodical half-court game -- on both ends of the court! Most of the teams the Nuggets have played in the past decade have had the ability to play slug-it-out halfcourt grinds, slowing Denver to a halt and keeping fastbreak opportunities to a minimum. This obviously applies to their early-aughts playoff games against the grindhouse Spurs, but it also applies to this Warriors team. Consider -- this team relies on Iguodala to steady the foundation of a defense that's rudderless and flagging without him. But Iguodala works better in a free-flowing defensive schema. When you're facing a team that can kill you if you give even an iota of space in a prolonged halfcourt set to the best shooter in the game, a free-flowing defense like the one Karl schemed doesn't work quite as well. You need a dogged insistence on sticking to your man and keeping him from getting open, not a flowing system of switches and band-aids.

  • THEORY #3: George Karl's few flaws can be magnified in certain situations. I'm not ready to be one of the hordes of people who are shoveling dirt on Karl's grave or calling him a terrible coach based on the results of a single series, or a somewhat underachieving past. Looking at the numbers, this isn't an insanely awful trend -- it's significant but it isn't life-threatening, I suppose you could say. I'd subscribe to theories #1 and #2 far quicker than I'd entertain anyone trying to tell me Karl's a poor coach, also. Those simply seem like bigger deals to me. And when it comes to designing out-of-bounds plays and building creative offensive systems, coaches I'd rather have at my side are few and far between. ... That said, he has a few odd tics that can doom teams in the playoffs. Those who've followed the Nuggets for extended lengths of time know what I'm talking about. As a recent example from this series in particular, his tendency to ride his veterans over the young talent has almost single-handedly doomed the Nuggets in several games. Andre Miller is one of my favorite players of all time, but he can't guard Stephen Curry at all and just about everyone knows that. Karl still put him on Curry for extended lengths of time, only for Curry to go NBA Jam-type hot against Miller's wizened defense. The Nuggets needed something different, but he stuck to his guns. That's something Karl does from time to time, and it can certainly shave a few points every now and again on a low-percentage move that simply doesn't pan out.

Now, let's step back a bit. The Nuggets can still win this series. They have two home games remaining, and although they're a sub-0.500 road team, the Warriors are as prone to a bad shooting night as anyone. A 3-1 disadvantage with two of three games remaining at home isn't a death sentence. But the Nuggets are on the brink, and it's worth wondering if maybe -- just maybe -- we've been overselling their home dominance all along, all based on a few regular season trends that simply don't apply in the postseason.

Or... it's just God disguised as Stephen Curry. Take your pick, really.


Continue reading

All's Quiet on the Eastern Front

Posted on Tue 15 January 2013 in The Stats They Carried by Aaron McGuire

east meets west

Hey, all. For today's post, I'd like to present some cross-conference matchup data. A lot of people discuss cross conference games from a perspective of raw wins and losses. I'm amenable to that, in the aggregate -- there are usually enough games that looking at raw intraconference wins/losses can give valuable results. Still, there's generally more insight to be gained by looking a tad bit behind the numbers -- not simply the raw number of wins, but how they came about, what sort of statistical quirks underlie them, and what teams are best against the opposing conference. You know, all that jazz. So come with me, friends, and let's get behind a few of the preliminary factors that drive 2013's main inter-conference trends, and note a few interesting quirks

Full-size table after the jump.

• • •

east meets west

I'm rather busy and crunched for time today, but here are a few observations.

  • First, while this isn't a historically lopsided cross-conference split, these are still some pretty startling numbers. The West has won 137 of 230 cross-conference games -- 59.6% of their cross-conference games, overall. The West has an efficiency differential of 2.94 against the East. In a single team, that differential and that winning percentage would translate to a 4/5 seed. And those numbers were arrived at despite, obviously, having heavy game coverage from the lower-tier western teams. Look at Phoenix, for instance -- they've already played 21 of their 30 cross-conference games, which means they have fewer games to go than several better western teams. A few teams of note:

  • Denver has looked pretty good in recent months, but their poor record against the East is one of the reasons they've yet to crack the West's top 5. It's possible -- even likely -- that they'll regress to their mean and post a better record in the second half of the season. Same is true about the Lakers, Grizzlies, and Clippers (all of whom have a lower-than-expected record against the East.)

  • Sacramento and Dallas -- despite overall records under 0.420 -- are barely below 0.500 against the Eastern conference. In fact, almost nobody in the West is. Only four teams are, actually with just Phoenix and New Orleans below 0.400. The inverse is true in the East, where all but four teams (Miami, Indiana, New York, and Atlanta) are below 0.500 against their Western brethren.

  • The San Antonio Spurs have won their eastern games by an average of 13 points per 100 possessions. This is despite sitting everyone with a pulse against Miami and playing 9 of their 16 Eastern games on the road. Also: despite their 2OT game against the Raptors.

  • How is the West doing it? Offense and defense. Fun fact: the East is marginally better on defense than the West over all games played (the East has posted a defensive rating of 105.9 by my numbers while the West is at 106.2), but in cross-conference matchups, the Western defensive attack tends to shut down the East's weaker teams while the Western offensive attack tends to obliterate the East's defenses. While the West gets about a point-per-100-possessions better defensively when they're facing the East, the Western offensive attack absolutely fillets a weaker-than-it-looks slate of defensive looks, especially for poor defensive teams like the Bobcats, Nets, and Bucks.

  • Going forward, most would intuitively assume there's a good chance this regresses to a less lopsided mean and the East closes the gap a bit. In theory, right? In actuality, I'm not at all sure this is going to happen, and it's more likely to get worse. The thing that one has to understand is that the current distribution of teams played actually tends to favor the East. Washington, Milwaukee, and Cleveland -- all teams that have been dismal against the West -- have a combined 54 cross-conference games left. Conversely, the East's 3 best teams against the West (Miami, New York, Indiana) have just 39 cross-conference games left! Although San Antonio has already played 16 of their 30 Eastern games, the Clippers, Grizzlies, and Nuggets combine for 51 remaining games. If you calculate out a full-season expectation for the final West/East win total, you get a number even worse for the East than the current reality, with the West going 271 to the East's 179 wins -- a final percentage of 60.2% in favor of the West.

  • The other issue that could exacerbate matters for the East is that of the playoff picture. If the East featured several teams racing for a playoff spot, you might expect teams to hold off worrying about lottery positioning until they were mathematically eliminated for the playoffs. But as things stand, there are about six Western teams racing for the last 2 playoff spots with legitimate cases that all but about 3 Western teams could make the playoffs -- that stands in stark contrast to the East, where one could make a relatively strong argument that the eight playoff spots are already completely decided. If the pressures of lottery-tanking start to depress the fortunes of the East's worst teams, that's only going to worsen the picture against a Western conference with enough legitimate playoff contenders to fill a league.

• • •


Continue reading

Using Talent Right: Title Contenders Force the Tempo

Posted on Wed 30 May 2012 in The Stats They Carried by Aaron McGuire

This is part of a two-part series. For observations on the Spurs and the Thunder's specific matchup, see 48 Minutes of Hell.

As one of my questions in Monday's Statistical Q&A, I fielded a question from the imitable Tim Varner of 48 Minutes of Hell. His query was whether the Spurs stand to gain in OKC smallball lineups by pushing the pace and playing fast. In short? Yes. I covered that today in detail at 48 Minutes of Hell, but there's a lot of interesting tidbits to be had in this table, enough so that I felt a separate post was necessary analyzing the trends and tendencies of the non-Spurs teams. To examine, I've produced this table that shows the W/L record, the offensive and defensive efficiencies, the eFG%, the efficiency differential, and the free throw rates of our four remaining teams in four distinct buckets of possessions. First bucket includes all games with under 91 possessions; the second includes 91-95; the third is 95-100; and the fourth and final bucket includes super-fast games with over 100 possessions. These are roughly quartiles of possessions. I placed in red a team's "worst" pace and in green a team's best.

Looking at this table, some interesting takeaways after the jump.

• • •

  • BOSTON: Bet you didn't expect this, huh? Out of all the paces the Celtics play at, one stands above all others as the absolute worst they could possibly play at. I refer, of course, to... an absurdly slow game? The Celtics force the pace low by Doc Rivers' own desires -- in the Big Three era, he has always preached a defensive-oriented strategy of keeping as few possessions as possible. This season, though, the Celtics have been bloody awful when they play their slowest. When they have under 91 possessions in a game, the Celtics have a losing record (12-15), a defensive rating WELL above their season average, allow teams to shoot almost 50% from the field, and barely ever draw fouls. On the other hand, when they play to a league-average pace, they're a really excellent team -- a +9 differential, fantastic defense, and a sparkling 16-4 record. Had you shown me Boston's numbers before I did this exercise, I wouldn't have believed it. But it's true. When the Celtics play super-slow, they're a terrible team. Doc Rivers may deserve a bit of blame -- no other team is more inefficient at forcing the tempo that suits the team best, and to some extent, that's on his game plan. Not a full extent, but certainly to some.

  • MIAMI: Little rhyme or reason to the Heat's numbers, though some funny stuff here. They average a differential of +7.1 in games with over 100 possessions, but somehow managed to go 5-4 on those games in the regular season. Which means they won those 5 games by over double the margin they lost by. Absolutely silly. Overall, the Miami defense actually gets a bit better as the pace goes up -- their real problems come on the offensive end. I take back my first statement. This actually makes a lot of sense to me. As a team highly reliant on two players, it stands to reason that there is some sort of upper limit on the number of possessions LeBron and Wade can use up in a single game. The more possessions the Heat use, the more likely that one of those extra possessions is something useless, like a Joel Anthony layup or another bricked Battier three. Thus, their offense gets a bit less efficient as the possessions rack up and they're forced to burn more possessions on their atrocious bench. As a mathematical example, assume LeBron a usage rate of 33%. In a 90 possession game, that's 30 possessions -- in a 100 possession game 33. That means that Non-LeBron players used 60 possessions in the 90 game and 67 possessions in the 100 game. What this means, big picture, is that even if the ratio is the same there are more possessions spent on players you know can't really give you much. In simplified terms... how easy is it for two players to have 50-60 out of 80 points in a slow paced game compared to 70-80 points out of 110 in a fast paced game? It takes more effort, and it takes an increase in a player's usage above and beyond simple extrapolation.

  • OKLAHOMA CITY: To hearken back to economics, the Thunder are in an odd position of not really having big marginal advantages over anyone in any one area, despite a lot of strengths when averaged across buckets. Their only real weakness is that they simply can't play slow-down, knock out ball the way a team like Miami can -- indeed, the Thunder actually were better than the Spurs at super-slow games, and far better than the Celtics. But against the Heat, that relative strength becomes a massive boondoggle. The, conversely, the Thunder are well above average at a faster-paced game... but still significantly worse than either the Heat or the Spurs! The only decisive advantage the Thunder really have in terms of pace is to play a very normal, league-average 91-95 possessions. My theory is that the Thunder defense gradually breaks down as the game gets faster, but the offense (isolation based and transition-heavy as it already is) doesn't have a second gear that allows it to become more efficient in a fast-paced setting. It's worth noting that the Thunder are fantastic at the league-average play, and in today's 48 Minutes of Hell post, I covered how the Thunder need to get back to their game and a league-average halfcourt pace if they want to get back into the series. I reiterate that here.

  • SAN ANTONIO: This is much like my statement in the Q&A, and by far the simplest relationship. As the Spurs get slower, the Spurs get worse. As the Spurs get faster, the Spurs get unbeatable, improving on both the defensive end AND the offensive end. They also shoot better, which speaks to Chip Engelland's yeoman's work in ensuring the Spurs maintain proper form on quick, set shots and the Spurs added efficiency when they force a transition-heavy, D'Antoni style of play. I discussed this a bit at 48 Minutes of Hell, so I won't belabor the point. But really: the Spurs are great when they play fast, and more than any other team left, they're the best at dictating the tempo and forcing teams to play fast. A deadly combination, that.

• • •

Long story short, I just mathematically proved why I don't want to watch the Heat-Celtics series! Therefore, I'm going to sleep through it. You know how I do. If that offends you as a reader, then I suggest that you link to YOUR mathematical proof in the comments. I promise I will read it and review it, and perhaps rethink my stance.

... Nah, probably not.


Continue reading

The Last 21 Games: Late Season Offensive and Defensive Rankings

Posted on Wed 09 May 2012 in The Stats They Carried by Aaron McGuire

For a more specific look at the surprising Spurs, see today's post at 48 Minutes of Hell.

It was recently brought to my attention that most people aren't quite as ridiculous as I. Let me explain. For much of the season, I've been offhandedly keeping tabs on the overall trends from an offense/defense perspective, through the view of eight-game moving averages, rankings in five-game spans, and a large spreadsheet updated when-I-remember with the latest summary data from Hoopdata. I was asked by my friend -- Tim Varner of 48 Minutes of Hell -- if I'd put together a complete post on the surprising late-season defensive renaissance by the San Antonio Spurs. Compiling my data into an easy-to-share form for the purposes of the post in question led my data to a form where it would be easy to share the whole league picture. Hence, I decided to make a post here about it as well, specifically taking aim at interesting trends (at the most rudimentary, league-wide level) over the last 21 games of the year and sharing the underlying data behind the graphs at 48 Minutes of Hell and the entire ranking. Onward, then.

• • •

DEFENSE AMONG PLAYOFF TEAMS: GAMES 45-66

This table reports the average of each team's defensive efficiency in 5-6 game stretches, labeled in the top row by the last game in the stretch. The final total is their overall average defensive efficiency in the last 21 games of the 2012 season, which makes up roughly a third of our compressed season. There are a few main takeaways from this data, on the rawest level.

  • The Lakers have looked OK on defense against the Nuggets, mostly because Denver has missed an insane amount of wide-open shots in the series. But their awful performance on the defensive end to finish the season should go down as one of the most incredible stretches of bad defense put up by a top-5 playoff team. Ever. Denver has their awful injury-riddled 45-50 stretch bringing their average down, Orlando missed Dwight for most of the schneid, and the Mavericks defense was worn down by age as the season concluded. The Lakers? No real excuse. In their last 21 games, the Lakers held opponents to an offensive efficiency under 100 only five times -- that's compared to allowing an offensive efficiency over 110 ten times. For all the talk about tanking, only four teams played worse defense down the stretch: Cleveland, Sacramento, Golden State, and Minnesota. That's right. Even the Bobcats, who lost their last 21 games by an average of 18 points a game, defended better than the Lakers over the last 21 games. Are you starting to realize how insane this is? (The Lakers went 13-8 over this stretch, by the way. Sometimes the world makes no sense.)

  • The general sense I've gotten from many on Twitter is shock and awe at how gritty, grimy, and awful the offense in first round has been for games in the Eastern conference. But what were we really expecting? Five of the top six teams that played the best stretch defense are in the east, and of those five, all but Miami succeed by making the game ugly and slowing down the pace. As of late, the only western teams playing above-average playoff defense are the Spurs, Grizzlies, and Thunder. That's it. That's your comprehensive list. Is it any wonder the Western bracket has been more fun to watch, to those who like offense?

  • Yes. The Spurs had the best defense in the West over the last 21 games. The numbers aren't here (simply because I haven't added them to this particular spreadsheet yet), but this has extended into the playoffs -- the Spurs have defended very, very well (despite a breakneck-fast pace that makes their opposing point totals seem high) to end the season. This really deserved its own bulletpoint.

• • •

OFFENSE AMONG PLAYOFF TEAMS: GAMES 45-66

Second verse, same as the first. Five game offensive efficiency averages, then an overall average over a team's last 21. Three observations, as before:

  • Yes, that's Denver way up top, at number two. They closed the season on an underrated hot streak on the offensive end, behind timely April shooting from Danilo Gallinari and Arron Afflalo. That, combined with the Lakers' atrocious defensive performance to close the season, is what led me to pick them as my one upset bid of the first round. Of course, I forgot the the second of two key rules of playoff basketball. First, you never count on the Hawks. Second, you never -- NEVER -- pick post-2002 George Karl to win a series where his team doesn't have an overwhelming talent advantage or home court advantage. Karl's inexcusably odd late-game playbook for the Nuggets as well as his always odd late-game rotation decisions have essentially doomed the Nuggets in this series. They should be up 3-2 right now -- instead, they're down 2-3 and came very close to getting gentleman's swept.

  • Reason number 2 why we should have expected the Eastern playoffs to look substantially different than their Western brood is rooted in the respective offense of its component teams. The only eastern offenses that performed at an above-playoff-average rate to close the regular season were the Pacers and the Hawks -- the Pacers don't really have much of an excuse for their ugly showing, but the Hawks are facing the best defense in the playoffs by a country mile. And, as everyone points out, they run one of the least creative offensive playbooks in recent memory -- if there's any team ripe for being shut down by a better defense, it's the can't-trust Hawks. There's a reason for the vast stylistic differences between the Eastern and Western playoffs, and it's not simply a tired narrative about how awful the East is. (Though, to be fair, we're sympathetic to that view here at the Gothic.)

  • There were four playoff teams that actually finished the season with negative efficiency differentials in their last 21 games (which, over a full season, would project to a sub-0.500 record). These four teams, along with their closing records:

  • The Orlando Magic (103.2 - 106.6 = -3.40) -- 8-13

  • The Dallas Mavericks (104.0-105.5 = -1.52) -- 11-10
  • The Los Angeles Lakers (108.1 - 108.7 = - 0.57) -- 13-8
  • The Philadelphia 76ers (101.4 - 101.7 = -0.29) -- 10-11

• • •

MIAMI'S SEASON-LONG SLOWDOWN

Reader @DerekJamesNBA sent us a tweet noting that it seemed odd to him that Miami has slowed down so much in the playoffs. I replied that it wasn't all that surprising to me, then decided I'd back that up with numbers. To wit, look at the above chart. That chart represents an eight-game running average of possessions per game played by the Miami Heat. You may notice a trend. Up until around game 22 of the season, the Heat were playing at a breakneck pace, akin more to the SSOL Suns than a usual Riley team. Then, out of nowhere? Their possessions per game average collapsed unto itself, and they spent the entire rest of the season playing at a pace that (over a full season) would've made them one of the 5 slowest teams in the league (and the slowest in the playoffs). It's a bit hard to tell, but they actually got marginally slower over the last half of the season. The average pace of their first round series has been tedious and slow, but there's no real surprise there -- this is how they've been playing since their blitzkrieg start. Perhaps they've done it to save LeBron's legs, perhaps they've done it to focus more on their halfcourt game. Either way, the Heat's style barely resembles the team that destroyed the league in the first 20 games, and that's been true for more of the season than you'd think.

• • •

To do your own analyses, I've put together a Google Doc that collects the per-game offensive and defensive efficiencies of every given team -- in other words, the raw data behind the rankings, in an easier-to-parse form than the overall totals on HoopData. Using this, you can put together charts for your own team of choice if you'd like to examine a specific team's evolving defense or offensive evolution as the series went on. Once I figure out how to use Tableau, I might add a few more visualizations to this post -- until then, hope the overall picture is sufficient for most of our readers. If you have any questions,


Continue reading

Pau Gasol's Infinite Sadness, by the Numbers.

Posted on Sun 01 April 2012 in The Stats They Carried by Aaron McGuire

Due to the crushing unpopularity of the "Gothic Ginobili" brand, we have decided to take the blog in a different direction. Welcome to "Goth Gasol", a blog whose sole purpose is to make you think about death and get sad and stuff. To start things off, we have provided a statistical assessment of Pau Gasol's infinite sadness. Required reading.

I'm gonna be honest. I used to get a little jealous sometimes. Of Zach Lowe, you see. Lowe is something of a wunderkind -- a great writer, a great guy, and generally one of the smartest guys around in the NBA writing game. He also, however, has connections. (Not conniptions, those are different.) For instance, he recently had me run a few numbers for an excellent piece he wrote on defending the corner three. It was a great piece, and I was honored to help out. But had it been the me from months prior, I wouldn't have been able to help being a bit jealous of his access to such interesting numbers. However, that all changed a few months ago. I am jealous no longer. See, I found this one guy. Or rather, he found me. His name shall remain anonymous. This is mostly because I have no idea who he is. He contacted me after my prior piece on Kobe as Stavrogin to send me a detailed spreadsheet of the number of times Kobe has invented a new cuss about wizards during each NBA game in the last four years. I have no idea how he tracked this. Not a clue.

I never asked, and I filed the numbers away for the next time I do an analysis on cusses -- a rare but ever-present option for me. Anyway, long story short, he sends me completely unsolicited spreadsheets every few weeks on things that either make no sense whatsoever numerically or make me wonder who in the world could possibly have these numbers handy. Given our new rebrand around the ongoing sadness of Pau Gasol, though, the data he sent me the other day is of the most paramount value. We now have statistics for the number of Pau Gasol frowns for each game of the 2012 season. Armed with these numbers, we may now examine the relationship between Pau's sadness, egg consumption, and the Lakers' winning ways. Anyways. This is the post you've all been waiting for. It's my big break. So, let's get to it.

• • •

A few notes on the data. For the purpose of this analysis, we are going to simply assume that the number of times Pau frowned in a game is equivalent to how sad he was on the given date. I do realize there are a lot of problems with this approach. For one, this isn't the frown rate -- this is certainly not a per-possession statistic, and that's problematic. Just ask any of the prospectus guys. And given that Pau plays a variant number of minutes per game (though, it's a Mike Brown team, so mostly just "all of them") that means we aren't necessarily comparing apples to apples. As well, we have the issue that there was no data dictionary supplied by my informant. I don't know exactly WHEN Pau consumed said eggs. What if he ate the eggs after the game? That could hardly be expected to influence his performance. Also, what defines a frown? Are all frowns truly created equal? There's no type of intensity spectrum for the frowns.

Anyway. Despite the flaws, this data can really start to shed some light on what makes Pau sad. To help stomach it, here's a rudimentary correlation table.

What does this tell us? Quite a lot. First off, there's a very high positive correlation between the number of field goals more that Kobe took than Pau took and the number of frowns Pau had in a given game -- almost a 75% correlation. This would tend to back my general impression -- Pau exhibits his enduring Spaniard Sadness more when he's been frozen out for shots by Kobe. I beg you, watch his game. Watch as he stands at his favorite spot on the floor, staring longingly into the abyss of Kobe's 25th isolation jumper of the night. Gaze upon the sadness in his eyes, and try deeply to internalize it. Ask yourself, dear readers: were you that sad, could you truly be expected to go hard in the paint? Well, no, not you, you're not even 6 feet tall! We'd put you on Nash. But you get the idea.

Many other aspects of this correlation table piqued my curiosity. For one thing, why the hell did my informant put in "number of days since Christmas"? It has no correlation to anything interesting, and only served to remind me of the Christmas cards I never put in the mail. I still feel guilty about that. I don't get why he had to give me that information. (Clearly, Pau doesn't either.) We get some nice splits on the eggs dimension -- an insignificant 1.1% correlation with sadness, but a higher-than-expected 12.5% correlation with the outcome of each game. It appears that the more eggs Pau eats, the more wins the Lakers rack up. To some extent. This relationship becomes even more prominent when you take out March 7th, a game where Pau had a great game and ate a season-high 25 eggs... in a loss to the Wizards -- if you remove that game, the correlation jumps to 25%. Truly an outlier performance from Gasol. In short: if the Lakers really want to win more, Jim Buss needs to keep the Spaniard's stomach assuaged and the piping-hot Paella flowing.

On the subject of splits, let's look at some key performance splits that the data allows us to examine.

  • When Pau Gasol has eaten less than two eggs on a game day, the Lakers are an abysmal 5-14. When he eats 5 or more, the Lakers are 16-3. Other than the previously discussed outlier, the answer is clear. When Pau eats no eggs, the Lakers lay one. Pau absolutely needs his eggs if the Lakers intend to be a force in the west to finish the season. This, however, will have little to no impact on Pau's sadness -- on less than two eggs, Pau averages 32.4 frowns a game. On greater than 5, he averages 29.5 frowns. An incremental decrease, sure. But nothing to write home about. Expect not a happier Spaniard, Laker fans. Also: there is a game (the OKC game a few days back, actually) in which Pau Gasol consumed negative three eggs. I'm not sure what that means. I'm not sure I want to know what that means.

  • Pau Gasol's play is, surprisingly, rather unaffected by his soul-crushing sadness. When Pau frowns less than 30 times in a game, he averages a game score of 15.9. When he frowns between 30 and 40 times, he averages a game score of 14.3. When he frowns more than 40 times, he averages a game score of 13.1. These aren't wonderful numbers, but they aren't really different. They're indicative of a man who fights through the pain, and plays through his sadness. The corresponding W-L records are as follows: the Lakers are 15-6 when Pau frowns less than 30 times, 11-11 when he frowns between 30 and 40 times, and 5-2 when he frowns more than 40 times. To a man of my statistical background, this would seem to indicate that the Lakers really need to keep close tabs on Pau's frown production in any given game. If he's having a "happy" game, then just stay cool. But if he's in that danger zone between 30 and 40 frowns? Turn up the taunting. Release the Kobe. The more Pau frowns, the more likely you'll get to that sweet spot of 40+ frowns a game, where the Lakers are (albeit on limited data) producing wins at a 71% clip!

  • Expectedly, as Christmas gets farther away, Pau Gasol gets more and more sad. His season low for frowns was on Valentine's Day, indicating that the Spaniard was on his best behavior for his lady-friend. I mean, don't want to harsh the mood, right? Much respect to the big Spaniard. Regardless. His 2nd lowest total was on Christmas, and that makes sense to me. After all. I'm Jewish (though my father is Christian and we celebrated Christmas as well as Hannukah in my youth), and even I can't help but be happy on Christmas. It's a time of joy, if you let the commercialized dead-eye Santa dolls into your heart. As Christmas gets farther and farther away, his sadness seems to be increasing -- and given that the Lakers have a 5-2 record when Pau is at his most depressed, that's bad news for every Western team hoping they'll collapse down the stretch.

When I saw this data originally I was going to create a model of Laker wins based on Pau's sadness and the exogenous factors in the data. I chose not to, because the data is relatively limited and I didn't feel confident that a model would really do better than just a straight analysis of the data. Regardless. I hope this post has helped shed some light on Pau's sadness for the uninitiated. Pau is a sad man, and it distresses me to no end to see him this way. Please send your regards. And if you have any idea who the hell sends me this data, tell him to stop reminding me about those Christmas cards.

... Also, perhaps more importantly, tell him to stop stalking Pau Gasol.


Continue reading

2012 Assist Infographics: Point Gods, Guards, and Quetzalcoatls

Posted on Thu 16 February 2012 in The Stats They Carried by Aaron McGuire

So, earlier today, the fantastic folks at Basketball Reference released to the public a marvelous database. It includes a highly interfaced and searchable play-by-play database for the past 10 years. This is, quite frankly, incredible. There's virtually nothing your heart desires that you can't search for -- player performance by the time left in the game, detailed stats of what happens when players make certain plays, team performance in certain situations... I don't think I'm being overly sycophantic when I say that this is among the greatest single advances in easily interfaced, searchable, and public statistical databases in the world of NBA statistics. There may never be any one or two people who mine the database for all the insight you can get from it. Ever. Long story short, it provides an easy way to answer certain questions, and the ability to learn how to raise better ones. To that end, I'll be doing a series of posts where I graphically demonstrate certain things that this database allows one to easily find. I hope that these will be useful to you. They're certainly interesting, if nothing else. Today's introductory topic as I sift through the data for interesting insights: how are assists distributed among the league's best setup men? Who are their most prolific partners? When in the game do they get them -- and what's the score when it happens?

Interesting questions. And it's easier to scratch at answers than ever. Let's dive in.

• • •

For this post, I'm producing graphs for the top 15 players in the league in AST% as of all games played on the 14th of February, 2012. Valentine's day! Because we love assists, here at the Gothic. For the data, you can go to our spreadsheet (or just search Basketball Reference yourself, obviously). I'm going to abstain from commentary in the post proper, because these graphs took a while to make and I think they speak for themselves quite well. I will commentate in the comments, if anyone wants to start a discussion. A few definitions, in case it's not immediately obvious. The charts are ordered 1 to 15 by assist percentage (or, the percentage of shots they assist when on the floor). Assists by margin refers to the margin of the game when the assist was made -- in theory, the "ideal" point guard would have more assists in a close game than in a game broken open. The assist target pie chart refers to, as one might expect, the players who completed the most baskets that the point guard (or the only non-point on this list, LeBron James) assisted on.

An interesting aspect (and one that I highlighted by using the team's secondary color to emphasize) of point guard play is what percentage of assists came from players outside their top 5 targets -- or, how many of their assists came from (usually) players they share less time with. Ricky Rubio is the best guard at taking advantage of the "others", with more assists coming to players outside his top five than any of those five individually. On the other end of the spectrum, Kyrie Irving has only registered eight assists outside his "main" five targets -- partly a reflection of the dismal quality of those others at finishing plays, perhaps partly an indicator that Kyrie's chemistry with the outer fringes of the Cavaliers pales to that of Ramon Sessions. The why is not our object, here, only the what. Assists by quarter is relatively self explanatory, and at the bottom of each infographic, you can see a demonstration through bars of how many of that guard's assists came on three point shots as opposed to two pointers (one area where Deron rules all comers).

All that said, here are the rest of the graphs. Enjoy.

• • •

Hope you enjoyed this trip through the seedy world of "hand-making infographics in Photoshop". For my next trick, I'll pass out in bed! Adieu, readers.


Continue reading

Introducing STEVE NASH, our 2012 Projection Model.

Posted on Sat 31 December 2011 in The Stats They Carried by Aaron McGuire

Hello, all. Today is going to mark, for us, the official rollout of the Gothic Ginobili preseason projection model. I made the model, Alex came up with the name -- "SRS-Tempered Evaluation of Variable Elucidation; Not A Simple Hyper-Segmented Linear Regression." Which... is an acronym for STEVE NASH, if you hadn't noticed already. Yep. It's either the best model acronym ever, or the worst. Try saying the model name out loud. It's hilarious, and I can't stop laughing. But it's memorable, reasonably descriptive, and honors one of the Gothic's favorite players. So... I guess it'll suffice, for now? Regardless. What is STEVE NASH? It's a model that attempts to use prior data project out what we should expect to happen in the 2012 season. I would never call it a prediction model, for reasons I'll explain in the introduction, but it offers decent projections of what to expect based on prior data. Come with me on a journey through the seedy world of model fitting, setting your priors, and managing expectations. Let's meet STEVE NASH, together.

• • •

I. INTRODUCTION

For access to the initial predictions, please see the spreadsheet.

In building a projections model (as opposed to a strict predictions model; see the next paragraph), there were a few things I tried to accomplish. The first? I wanted to ensure that the results were comprehensible, reasonable, and easy to use as a prior base to help establish our weekly projections we're going to start putting out next week. I wanted to have a single predicted variable, one that we could then turn into wins, losses, and probabilities that various teams make the playoffs. So I created a model that would predict -- based on past data and a few sparing summary statistics for the team's current season -- the SRS rating of each NBA team entering the 2012 season. I didn't want to predict wins, because teams win more or less than their true quality all the time (how many games hinge on an uncharacteristic fluke or a single shot?), and wins aren't a continuously distributed variable in the same way SRS is (the Pacers can't have 29.3 wins, suffice it to say). Still, SRS is nice for many reasons, and the simplicity and clarity is what make it my predictor of choice. All SRS does is take the team's margin of victory and add the team's strength of schedule, to downweight the rating of teams who played weaker schedules and upweight the rating of teams who played stronger ones. For the lowdown on SRS -- including how to use it to predict spread and favorites in games (a fringe prediction we can make with this model) -- I'd prefer to redirect you to this great post at Basketball Reference on the subject (and, if you're more mathematically inclined, this more technical intro is very cool).

While it's true that I'm predicting future SRS, this isn't really a prediction model. Most people muddy the difference between a projection and a prediction when they discuss model output. But they're very different animals: A projection is an attempt to put together all the information we currently have into a numerical summary of what we already know. A prediction, on the other hand, is speculation about things we can't possibly know. My go-to article to link in explaining the difference between the two is this excellent FanGraphs post by Dave Cameron). In creating a projections model, I'm essentially attempting to create a simple ranking of how good we can expect certain teams to be. I realize that the projections my model spits out aren't going to be very good predictions -- by design, this model regresses to the mean (making the extremely good/bad teams this season look like middling .650/.350 teams) and assigns a high standard deviation to each team's SRS. It uses prior data to try and find the teams that are poised to make serious leaps, or take a serious spell. It tries to project the best team in the league. Et cetera, et cetera.

The projected wins totals aren't going to hold up after a full season -- one or many teams are going to get hot and end with 44+ wins, even if the current best team is only projected to win 40. There are some teams we can be virtually positive these playoff probabilities underrate (I'd put Miami and OKC at a 100% shot of making playoffs). And there are some teams that this model definitely underrates (Portland at 66%? New Jersey at 4%? Dallas at 20%?). But on the whole, the model gives a reasonable expectation based on seasons past. To test the model, I used two years (1999 and 2011) as a holdout sample and ran the model process on every other season in our data (1993-2010) to ensure it was giving us proper coverage. The results for those years had the same feel of the results for this year -- primarily conservative mean-regressed predictions, one or two big leaps, one or two big falls, and enough creativity in its projections that it brings something new to the table. One thing to keep in mind while you peruse these projections: these are based in no way on the current season data. That will come into play in 2 or 3 days -- for now, these projections are based only on data available to us prior to the first day of the season. This model is only a prior: As the season goes on, we'll be weighting the projections against the new, actual SRS data of the season.

• • •

II. THE LOWDOWN OUT WEST

STEVE NASH sees the stage as pretty wide open out west. There are five teams that the model places as a greater than 7.5 percent shot at winning the west in the regular season -- the Spurs (29.6%), Thunder (16.5%), Nuggets (20.1%), Rockets (12.4%), and Lakers (9.3%). Of these, I'd caution that the Spurs have more downward momentum than the model assesses (especially with the short leash Pop is going to give the Spurs' vets this season to try and keep them playoff-fresh), and I'd drop them and the Nuggets a few points to raise the Thunder a touch (if I were making personal predictions). The model is low on the Thunder's potential to improve, as well, which I found interesting. It essentially sees the Thunder and the Nuggets as a tossup to win their division, with the post-Melo Nuggets ending up with a lower SRS but a higher variance in their final result (which leads to them leading the West more often than the Thunder in the projections).

You may look at that and wonder about the omission of the Mavericks. Well, I did too, until I noticed exactly how far the model predicted they'd fall. In a word? Wow. Without question, the model's biggest prediction and biggest reach is in predicting that the 2012 Mavericks are going to plumment this season, falling all the way from the eighth best SRS in the league down to an SRS of -2.103. Because that's an extremely interesting prediction (considering that these predictions come using exactly zero of the games currently played as data), I went deep into the model to try and figure out the true drivers of that prediction. The root of the Mavs problems? Teams with little depth that rely on one or two efficient players don't project well in this segment. Neither do old teams, and the 2011 Mavs are one of the oldest teams in this sample. The Mavs are incredibly old, as I covered in my Mavs preview -- it's not necessarily a death knell for a roster to be old, but for teams in this segment, it kind of is. This all said, I have to stare at that and think they'll get better. I don't think they're a title contender, but they're not nearly as bad as the 2011 Warriors or Clippers, two teams in the general range of the predicted SRS for the 2012 Mavericks (-2.103). I expect the model will be proven wrong here.

Other points of contention? I think the Blazers, Clippers, and Thunder will be better than the model does. I think the Jazz, Suns, and Kings will be worse. They're reasonable projections all around, despite my disagreements, but I expect this model will have one or two teams make it look somewhat silly out West, highlighted by the Mavericks. Which is fine, all things considered -- I'd rather have a model that makes mistakes and learns from them than one that takes the easy choice every single time. You're an OK guy, STEVE NASH.

• • •

III. THE LOWDOWN OUT EAST.

Well, what else was it going to say, right? The Heat are allotted a 42% chance of winning out the east, and are essentially assured of making the playoffs. Behind them, the Magic have a puncher's chance at 19%, the Bulls have a long but decent shot at repeating their best-in-class 2011 (14%), and the Celtics and Knicks are distant wildcards at 10.4% and 7.5% apiece. Unlike the no-dominant-team West, the Heat fit the bill out east, completely destroying their division and The entire playoff picture is relatively clear, though I think the Pacers may supplant the Celtics in the top 4. In fact, scratch the "may". I'm pretty sure they will. So I very much disagree with my model on that one. But I respect its right to have such an opinion, because I am a respectful man. There aren't as many points of contention in these projections, I don't think -- I'm surprised the Nets are so low, but then I looked at their roster and was less surprised. It's going to take more than Deron Williams alone to make that roster into a contender.

• • •

IV. APPENDIX: STATISTICAL METHODOLOGY

For more details of the statistical methodology, see the appendix here.

• • •

This concludes today's rollout of the model. In 3 or 4 days, we'll post our first set of weekly power rankings that combine this season's data with STEVE NASH in order to create updating projections of win totals and probabilities throughout the season. Until then? Have fun with today's games, and have a happy New Year. Stay safe -- only a fool drives drunk, and there's a lot of fools afoot on New Years.

Continue reading

Alex Learns Stats: Drawn and Quartered

Posted on Thu 15 December 2011 in The Stats They Carried by Alex Dewey

Aaron's fascinating look into the inherently deleterious effect of the compressed season on injuries (focused on effects wrought solely because more games fit into the same recuperation period) got me thinking. As stat posts are wont to do. What if it weren't the number of games that were compressed, but the games themselves? We've all heard the tired LeBron jokes. I tried to make change with LeBron, but he didn't have a fourth quarter. Well...what if nobody had a fourth quarter? How would we make change then?! What if that was the price of the lockout? What if Commissioner Stern, in a jaw-droppingly flamboyant abuse of power, declared that the cost of a lockout would be felt every night, for 12 missing minutes?

... well, I had some spare time and wanted to try my hand at these public Google Doc spreadsheet posts that Aaron has been using, guess we're going to find out. Follow me hither to the magical world of endless, tedious data entry, where Aaron and I frolic among the sparse statistical flowers of wisdom to be found there. This is kind of a curiosity, but there were a few interesting surprises.

• • •

Part I: the Data and the Damage Done

For this part, turn to Sheet "Game Data" in the spreadsheet.

Let me walk you through this sheet: As you will quickly notice, the results of each game in every 2011 playoff series (15 series, 81 games in all) are listed; Eastern Conference first, Western Conference second, Finals last. My source for this was the decent 2011 NBA Playoffs Wikipedia page. For each playoff game there are two rows: one row for each team, containing their performance in each of the four quarters and OTs if necessary. These seven columns (and then the "F" column denoting final score to the right) are straightforward. After that, NQ1, NQ2, NQ3, and NQ4 give the final score of each of the games if (respectively) one of the quarters had been unceremoniously lopped off the game (the latter naturally, by $tern, thereby protecting his most marketable player LeBron from his characteristic fourth-quarter meltdowns). The next four columns summarize which team (if any; there were 5 ties) won the game when the quarter in question got lopped off. For example, the first series listed is Bulls-Pacers. If you lop off the first quarter of Game 1 (which the Bulls actually won 104-99), the new final score is 81-72 Bulls.

Part II: Series Swing, via Django Reinhardt

For this part, turn to Sheet "Series Summary" in the spreadsheet.

"If only Stern had gotten rid of the fourth quarter like I've been saying for months, we might've beaten the Mavericks!"
--Heat, Thunder, Lakers, Celtics, Pacers, Bulls fans

This page concisely summarizes some of the data from the "Game Data" page. Here you see the 15 series from this year's playoffs, with 5 groups of columns: First the actual result (so, say, for Bulls-Pacers, the actual result was 4-1 Bulls). Then the four alternate results of the series if you remove one of the quarters from every game. If you remove the first quarter of each of the games in CHI-IND, the series is a less dramatic 3-1-1. It was a hilariously close series (not so much if you're a Bulls fan), wasn't it?

Anyway, a big takeaway is that a lot of series swung on individual quarters (full list below). If you take out the fourth quarters, the 4-1 Bulls-Pacers Series becomes 2-2-1. (You can see this in the Game Data page, but it's clearer and more concise on the "Series Summary" page). This 2-game swing was actually quite common for series: In fact, in 13 of 15 series, removing at least one of the quarters either swung or tied the series. Even the two sweeps (Celts-Knicks, Mavs-Lakers) had a quarter (3rd, 4th respectively) that, if removed from every game in the series, tied up the series at 2-2. Of course, the Thunder-Grizz series was 4-3 Thunder (as the series ended up) except for with the 2nd quarter removed, in which it's 4-3 Grizz. That sounds about right.

Strangely, the only two series that didn't hinge on any of the quarters were Bulls-Hawks and Lakers-Hornets. More on the Hornets series later (because it's a hilarious exception to everything here, as you'll see).

Here are the quarters without which various series swung victors or were tied up:

Eastern Series Swings:

  • Bulls 2, Pacers 2, 1 Tie, Q4
  • Heat 2, Sixers 2, 1 Tie, Q2
  • Celtics 2, Knicks 2, Q3
  • Magic 4, Hawks 2, Q1 (Magic take a decisive victory!)
  • Heat 2, Celtics 3, Q4 (And the Celtics likely advance without the Heat's fourth quarters)
  • Bulls 3, Heat 2, Q4 (And the Bulls likely advance without the Heat's fourth quarters)
Western Series Swings:
  • Spurs 3, Grizzles 2, 1 Tie, Q1 (An astonishing 3.5 games hinged on the first quarter [G1, G3, G5, and G6]. That's right, in 4 of 6 games the winning team won the first quarter and the losing team won the rest of regulation by a smaller margin. None of the conclusions in this piece are very strong, but this fact is strong empirical evidence that Spurs-Grizz was one of the best series of this or any playoffs.)
  • Mavs 3, Blazers 3, Q2 (With only a one-game difference from the actual result, this is not too strange on its own, but note also that 3 games actually hinged on this quarter).
  • Thunder 1, Nuggets 3, 1 Tie, Q2...alternately, Thunder 2, Nuggets 3, Q4 (This was the only series that hinged on the removal of two separate quarters. Not mathematically impossible, but kind of spooky, especially considering that the series was so lopsided by record and there were only 5 friggin' games (and 4 Thunder victories) for it to swing. Depending on how you look at this, the Thunder either executed when they needed to or barely won an eminently winnable series.)
  • Lakers 2, Mavs 2, Q4 (this is kind of a running theme for Dallas)
  • Mavs 2, Thunder 3, Q4 (see?)
Finals:
  • Mavs 2, Heat 4, Q4 (how does that joke go?)

Part III: the Most Exciting and Least Exciting Teams

For this part, turn to Sheet "Results by Team" in the spreadsheet.

If any of this seems "unmotivated" or "slipshod" to you, you're probably right. This is mostly a curiosity. I wanted to use the larger sample size of a regular season, but I couldn't find a database with readily available quarter data for each game. A spidering script would probably be necessary, and although Aaron is actually really good at writing those, he's busy right now and I don't have quite the experience he has. Even with the larger sample, the results simply wouldn't be very meaningful in all likelihood, at least not without lineup data and some (READ: any) degree of statistical sophistication.

That said, there's still an mathematical interpretation that motivates all of this: The number of quarters on which a game hinges approximates the probability that you're watching the decisive quarter at any given point in time in that game. If there's a game where removing the second or fourth quarters of a game can change the outcome, then if you pick a quarter at random to watch, you're 50-50 going to be watching a decisive quarter (and then at some point, very likely, a decisive run). This logic goes for series as well: Let's say you're watching the Spurs-Grizzlies series for one quarter, where 6.5 total quarters turned out to be decisive (that is, where removing the quarter changes the outcome of the game [I awarded .5 for ties]). That means if you're tuning in, there's about a 25% chance you're watching the quarter, the run, on which the whole game may swing. Granted, it might not be very exciting to watch a first quarter that the Grizzlies win by 8, even if the Spurs come back to lose by 2, but the point is, the quarter mattered directly to the outcome (and hence the narrative) of the game and of the series, and you had a relatively high chance to see it.

It's kind of silly to call any close game inherently exciting, but March Madness is so iconic for a good reason: A highly contested outcome can make decent games into great games and great games into transcendent games. And it's hard for a game in which two quarters are separately decisive to the outcome not to be incredibly close. With this slipshod and specious logic in mind, let's consider the most "exciting" series of the playoffs by the total number of decisive quarters:

I'm not going to trumpet these numbers. I do think it's telling that whenever a series seemed more interesting than these numbers establish, it's usually because the fourth quarter accounted for most of these swings (see, Mavs-Heat). Also, if you listed your most exciting 5 series from 2011 as the 3 Thunder series, Spurs-Grizz, and Mavs-Blazers, you wouldn't be too far off. There's at least some sort of strong correlation between excitement and total quarter swings. But yeah, the numbers seem just a bit off. So I made an adjustment: I did a weighted average of the first through fourth quarters, where the fourth quarter swings count (arbitrarily) 6 times as much as the first quarter swings. I also weighted the 2nd quarter swings twice as much as the first and the third quarter swings three times as much. Below is the new result:

Okay, well, that doesn't change all that much in terms of rankings, but every Heat series goes up, every Thunder series goes up (!), and every Dallas series except the Blazers went up. That sounds about right. Also, the Hornets-Lakers series goes down even further? This makes sense: It was by far the series with the fewest quarters that outcomes hinged on. In fact, there was only one quarter in the whole series that was decisive to the outcome of a game, and that decisive quarter was Q2 of Game 4. The Hornets actually hung on to win by 5 while winning the quarter by 7. Using quarter swings (with or without adjustment) just isn't a perfect measure of excitement, as the Hornets series tells us -- that series was exciting as hell.*

*An exciting series not in the "close game" way; it was more of a "Chris Paul may be tiny but he's also the most technically skilled, tenacious, creative player in the entire league and there's an outside chance he shocks the world in this series" way.

Anyway. The bottom table on this page of the spreadsheet is just a retread of the stats in "Series Summary." On the top table, we look at actual W-L records by team, and their alternate records if all of one of their quarters had been lopped off each of their games (by $tern; I can't $tre$$ thi$ enough).

Here's a summary chart:

For me, there are a few incredibly strange details here: ATL had a rather inexplicable 3 game net in the first quarters, and Chicago had a pretty surprisingly negative haul considering they went to the ECF. But really, look at Miami's: It's the one with the red/green bars above the line and nothing else. Apparently - even with the infamous Finals chokes - they overall netted 2 games in the fourth quarter (i.e. they would've lost or tied 2 more games without the 4th). And then they netted 3.5 games in the second quarter and then nothing in the first and third quarters. I guess... asking LeBron for change is actually a very strange proposition. Maybe you get two of those Kennedy half-dollar pieces or something?

Whatever coins you'd get, it's not as strange as asking Dirk. I'm kicking myself for not making the color scheme above out so that the Mavs (that gigantic pillar a bit right of center) would have a German flag in the three colors. Whatever the colors, they show us a marvel: Out of 21 games and just 16 wins, the Mavericks netted 5 games on decisive fourth quarters. I mean, many of us saw him claw back to dominance in Games 4 and 5 of the OKC series and Games 2 and 4 of the Heat, not to mention a couple Lakers games. Still, it's pretty amazing that despite that B-Roy throwback in which Dallas choked harder in the fourth than possibly any other team this playoffs... in the end tally, they still netted +5 wins in the fourth quarter. And then they netted 2 each in the second and third quarter. I think it's fair to say that Dallas was almost certainly not benefiting from sheer random chance alone in these numbers. You have to wonder what Mark Cuban's staff and crew is up to, and this is another piece of weird evidence in their favor. Also, check out Denver. Somehow, in 5 total games they managed to lose in 5.5 decisive quarters and win in 1 more. Again, mathematically this is possible. But it's spooky. That was a freaky series.

Anyway, using my definition of "excitement" from above, I created an "Objective Excitement Index" for each team. The meaning? Well, for every 100 points on a team's OEI, there's (on average) an extra decisive quarter per game on which the margin of victory hinges. For a 100 OEI team, there's a good chance that a random quarter you're watching of them is decisive to the game; for a 50 OEI team, there's only going to be (even one) decisive quarter about half the time. The highest theoretical value is 300, for a team that always wins (or loses) one quarter out of four, but manages to lose (win) the game in the other three quarters, in such a way that all three of the losing (winning) quarters are decisive. This happens, for example, if a team loses a game by 1 by losing each of the 2nd, 3rd, and 4th quarters by 7 (net: -21), even though it wins the first quarter by 20. This has to happen in every game, win or lose, for a team to have an OEI of 300. The average OEI for teams in the playoffs was about 80. In the 2011 playoffs, Denver had an OEI of 130, averaging 1.3 decisive quarters per game. This is really spooky. Possibly stranger is the Thunder having a 120 OEI in 17 games. I also did a "Clutch" version weighted as above (1,2,3,6 for each quarter). But enough talk; let's look at the chart:

Conclusions

Not too many bombshell surprises here. But definitely some nice charts. Especially unsurprising is how many games seemed to hinge on the clutch quarters (22.5 games actually hinged on the fourth quarter compared with 14, 18, and 7 for the other three). I think that's a major reason the playoffs seemed so good this season. For the most part, you never felt like a game was going to be bad going in (at least ignoring the two Hawks series), and even if your favorite team got killed by a transition masterpiece in the third quarter of Game 4, you still knew the execution in the fourth quarter was going to get better, and that your team would still have a chance next game. The end of regulation for the Spurs against the Grizzlies in Game 5 is one of the great sequences of offensive execution in the history of basketball (sorry, bias creeping in there, but really, 4 different San Antonio baskets in 40 seconds, damn!), and despite being brilliant and enigmatic, that type of execution was characteristic of the West playoffs.

It would really be nice to get a larger sample size for a real analysis of these numbers that couldn't be explained away by sheer random chance (except for Dallas and Miami, really, who both produced incredible, qualitatively clutch performances on their respective paths to the Finals before the Mavs took the decisive upper hand in Games 2 and 4), but this is mostly a curiosity anyway. A fun one, but a curiosity all the same.


Continue reading